 Zastre, Kent & Wilson
Meta Ads
How your Facebook and Instagram ads are doing, and what they turned into.
What is this page?
Meta is the company that owns Facebook and Instagram. We run ads there for you.
This page shows how much the ads cost, how many people became leads, and how many of them bought.
It has three tabs at the top: Dashboard, Sales and Funnel.
Dashboard tab
Pick the days you want with the buttons at the top (Today, 7D, 30D and so on).
Under "Data" you see spend, clicks and leads. Under "Insights" we write what is working and what to change.
The Overview, Ads, Creative styles and Leads buttons switch what you are looking at.
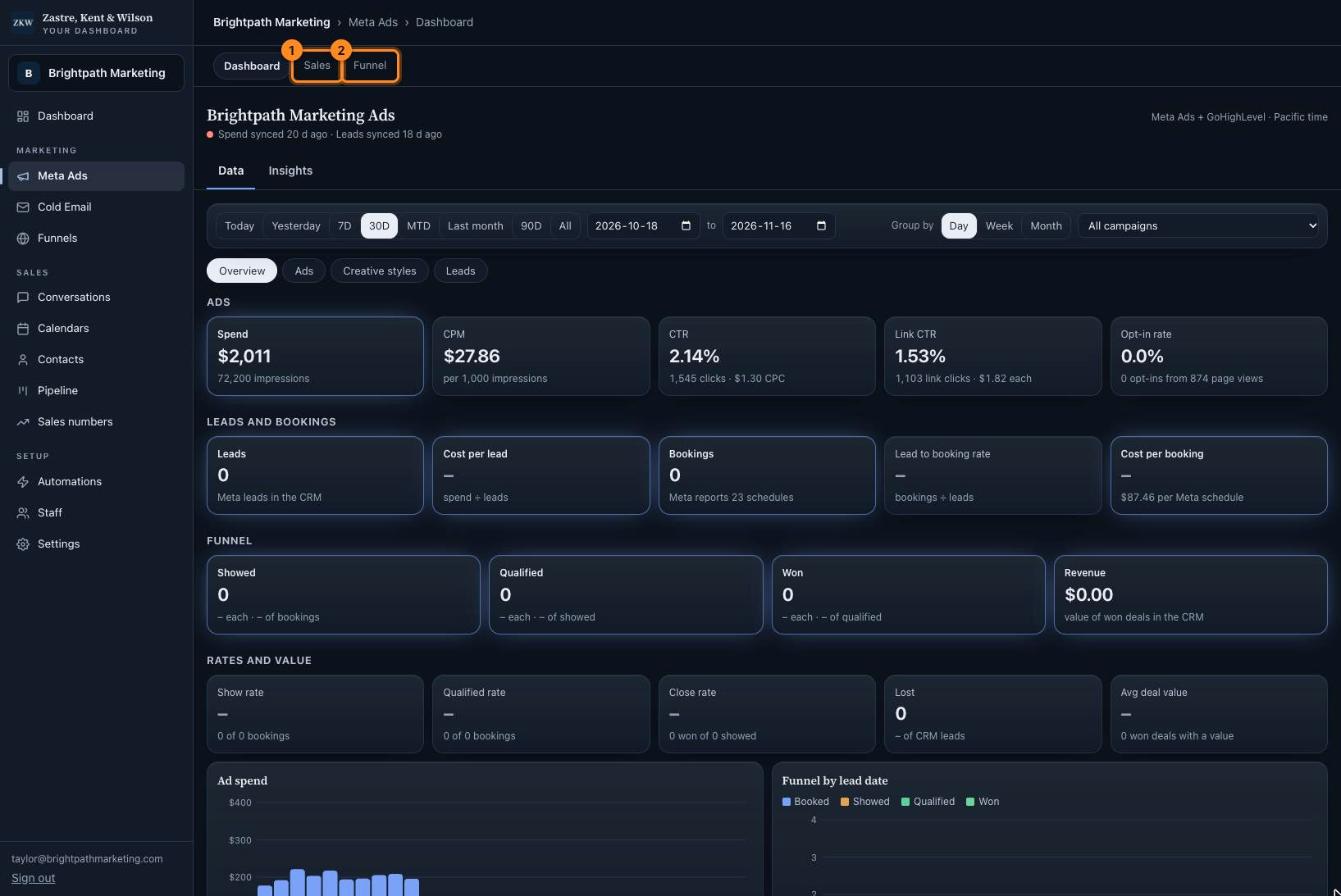
- The Sales tab.
- The Funnel tab.
Sales tab
"Cash per $1 spent" tells you how many dollars came back for every dollar of ads. More than 1 means the ads paid for themselves.
The tables at the bottom show the same numbers for each campaign and each ad.
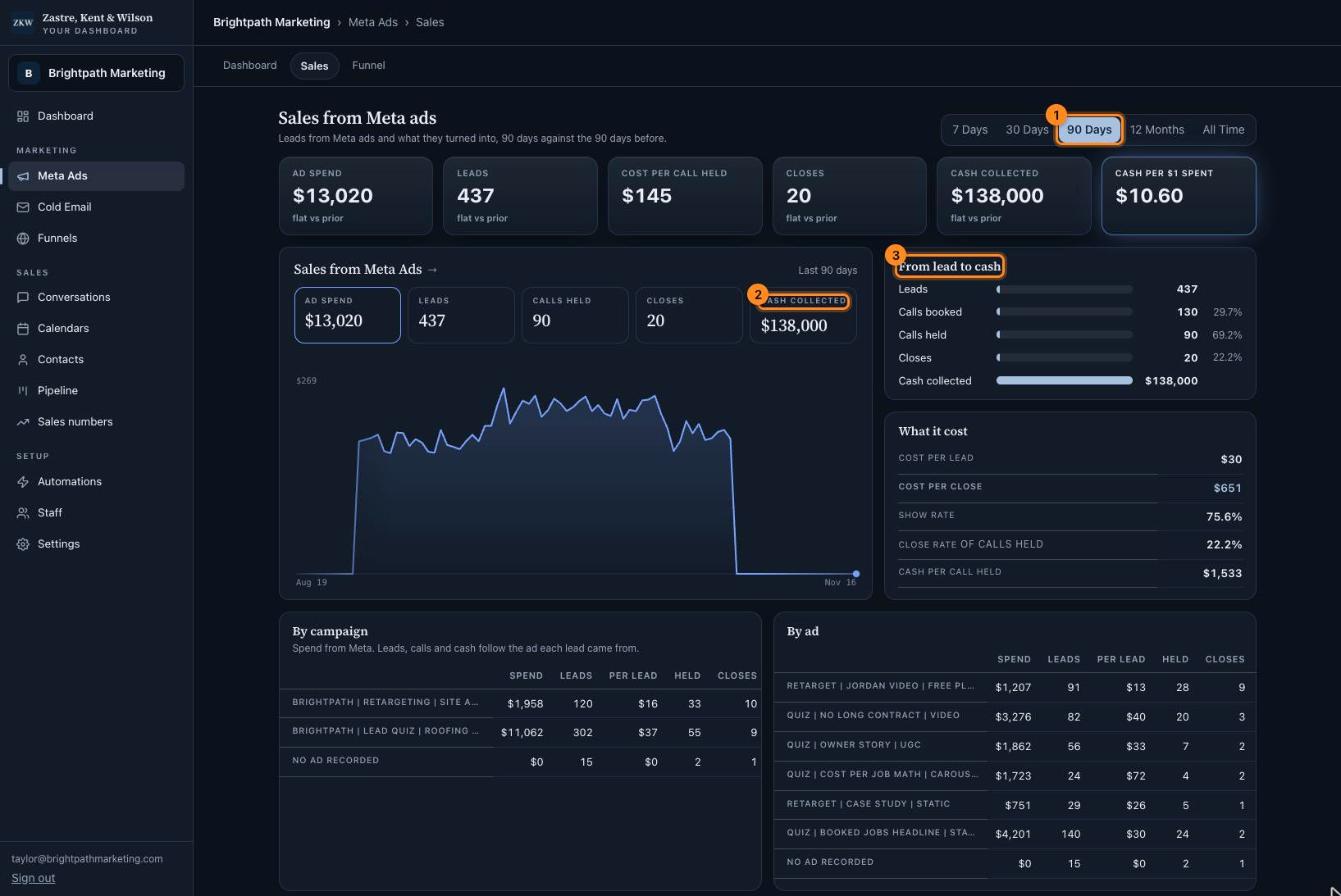
- Pick how far back to look: 7 days, 30 days, 90 days, 12 months or all time.
- Click a small box to change what the chart shows.
- From lead to cash. How many leads booked a call, showed up, bought, and how much cash came in.
Funnel tab
Think of it like a slide. Lots of people start at the top, and fewer get to the bottom.
A step marked "OK" is doing fine. A step marked "Weakest step" is the one to fix first. We tell you why in the box above it.
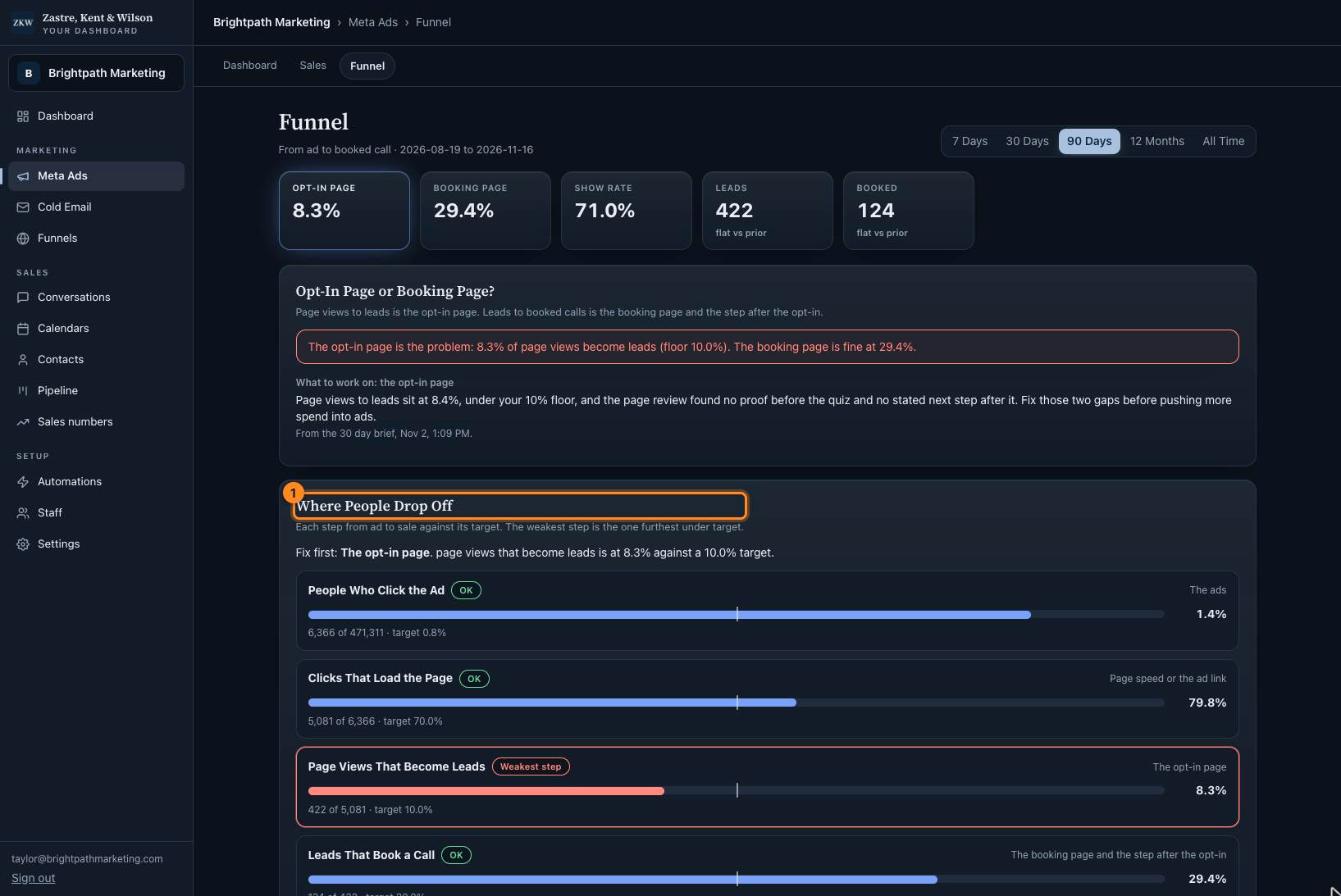
- Where people drop off. Each bar is one step, from seeing the ad to buying.