How many calls you held, how many you closed, and who on the team is doing best.
What is this page?
It turns all your calls and deals into simple scores, so you can see what is working.
Company tab
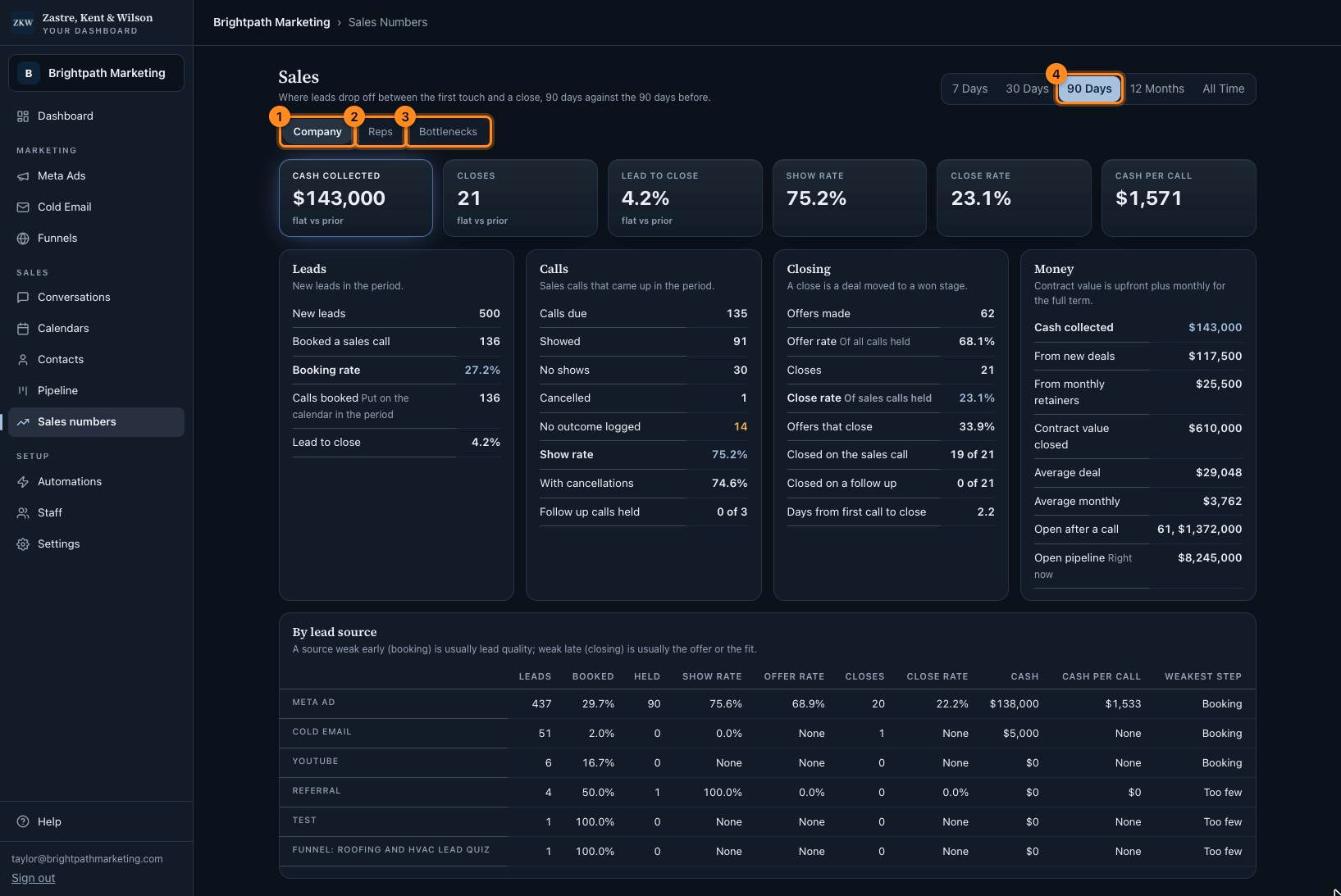
"By lead source" at the bottom shows which place (ads, cold email, referrals) brings the best buyers.
1Company: numbers for the whole business.
2Reps: a scorecard for each sales person.
3Bottlenecks: the step where you lose the most deals.
4Pick how far back to look.
Click the picture to see it bigger. The names and numbers in it are made up.
Reps tab
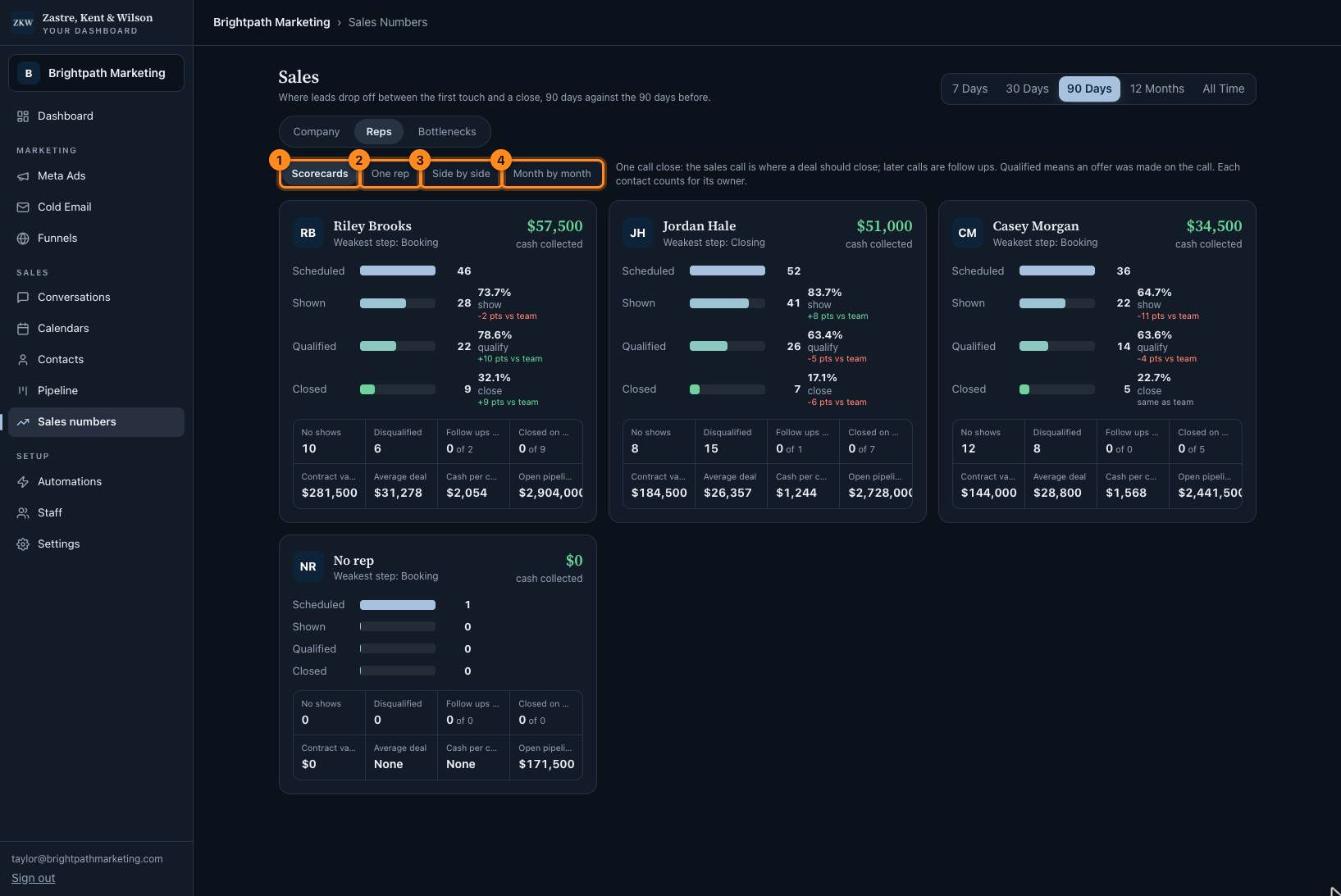
Each card shows how many calls a rep had, how many showed, how many got an offer, and how many closed. Green "vs team" means better than the team. Red means worse.
1Scorecards: one card per rep.
2One rep: look at one person.
3Side by side: compare reps.
4Month by month: see how each month went.
Click the picture to see it bigger. The names and numbers in it are made up.
Bottlenecks tab
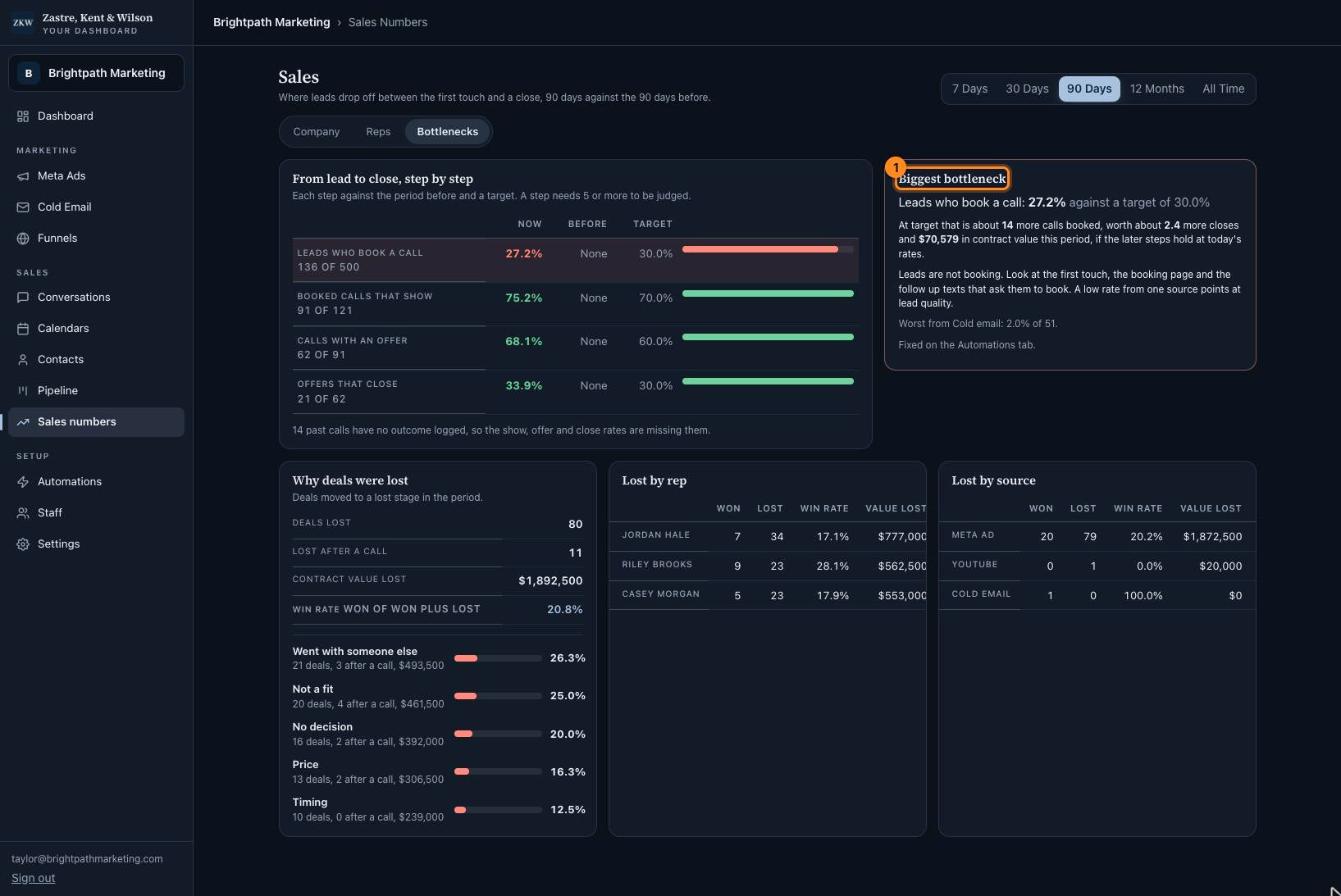
A bottleneck is the narrow part of a bottle. It is the step where most deals get stuck.
"Why deals were lost" shows the reasons you picked when you logged each call.
1Biggest bottleneck. The one step to fix first, and what fixing it could be worth.
Click the picture to see it bigger. The names and numbers in it are made up.
 Zastre, Kent & Wilson